2.8 Project: Detecting Emotions from Text
Contents
2.8 Project: Detecting Emotions from Text#
Let’s do another sample project connected to text classification. In this lesson, we’ll test an emotion classification model from the Hub.
Emotion Detection#
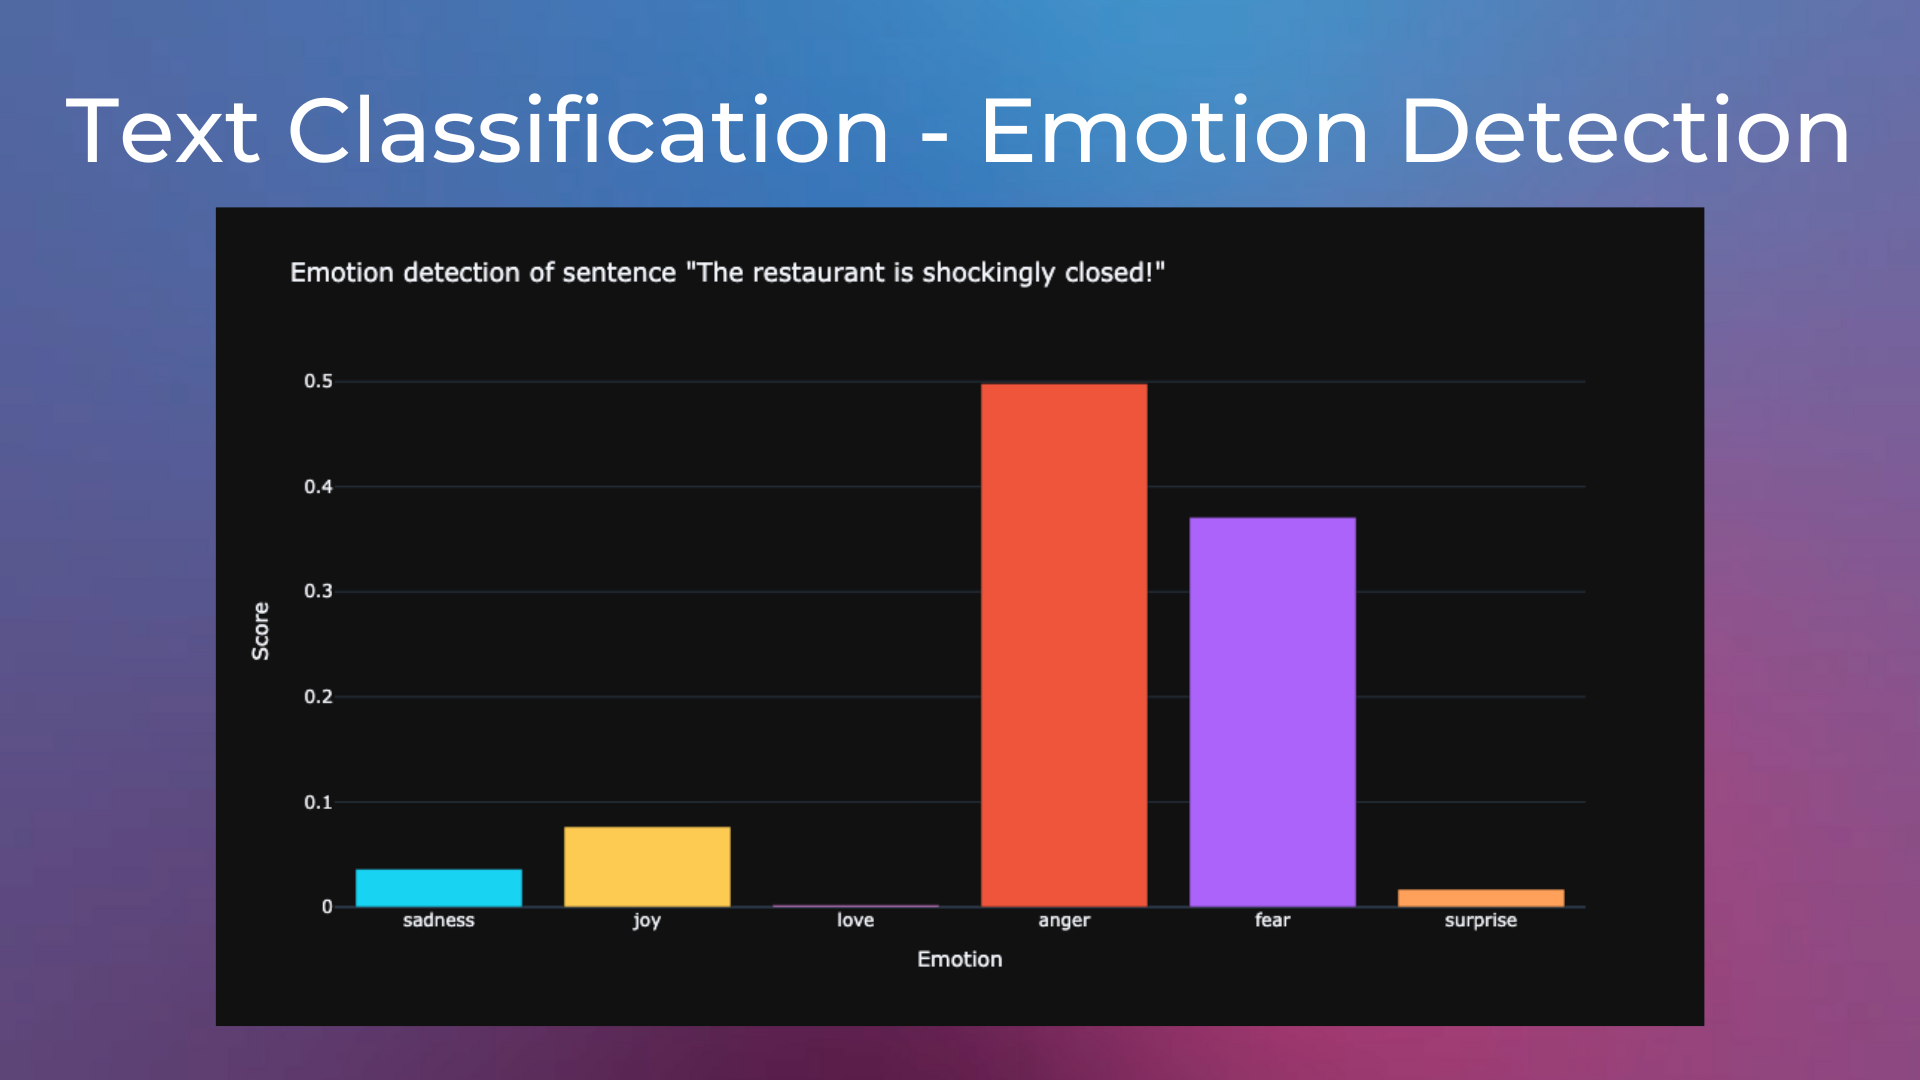
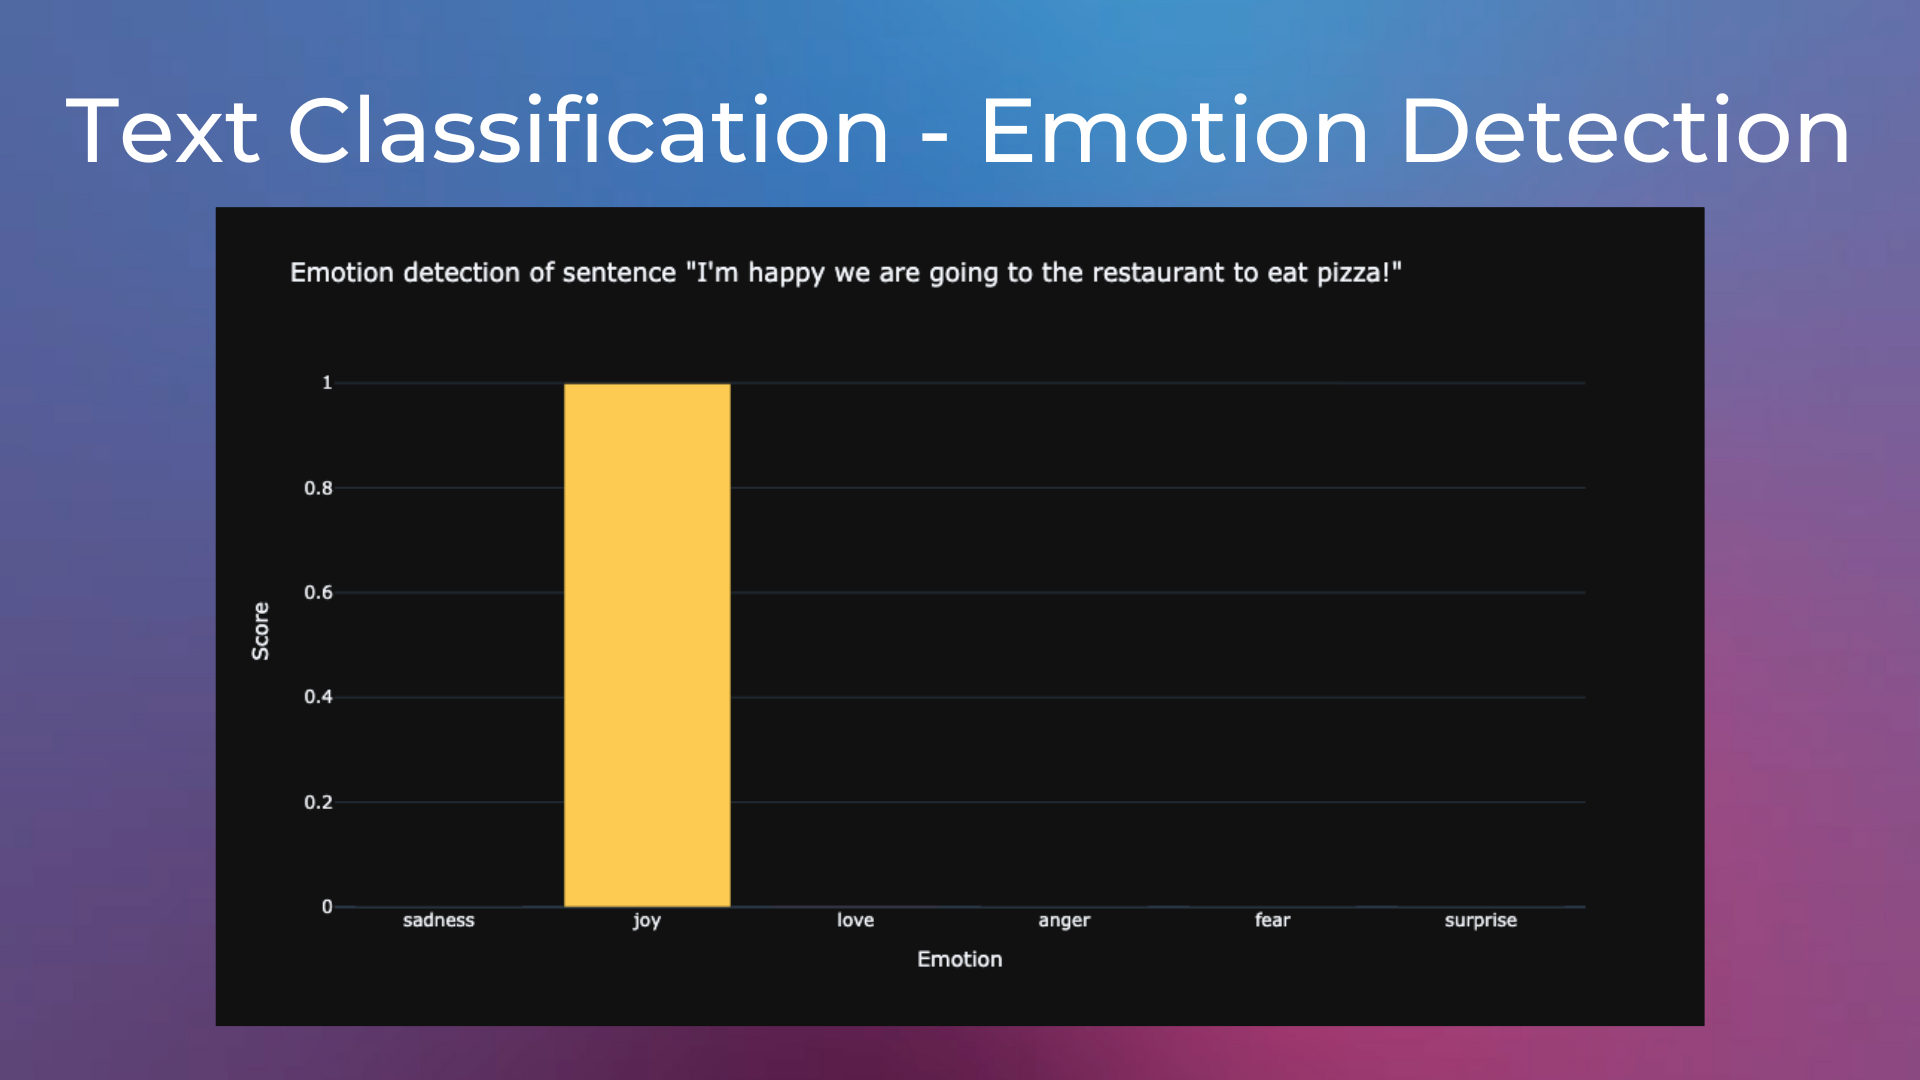
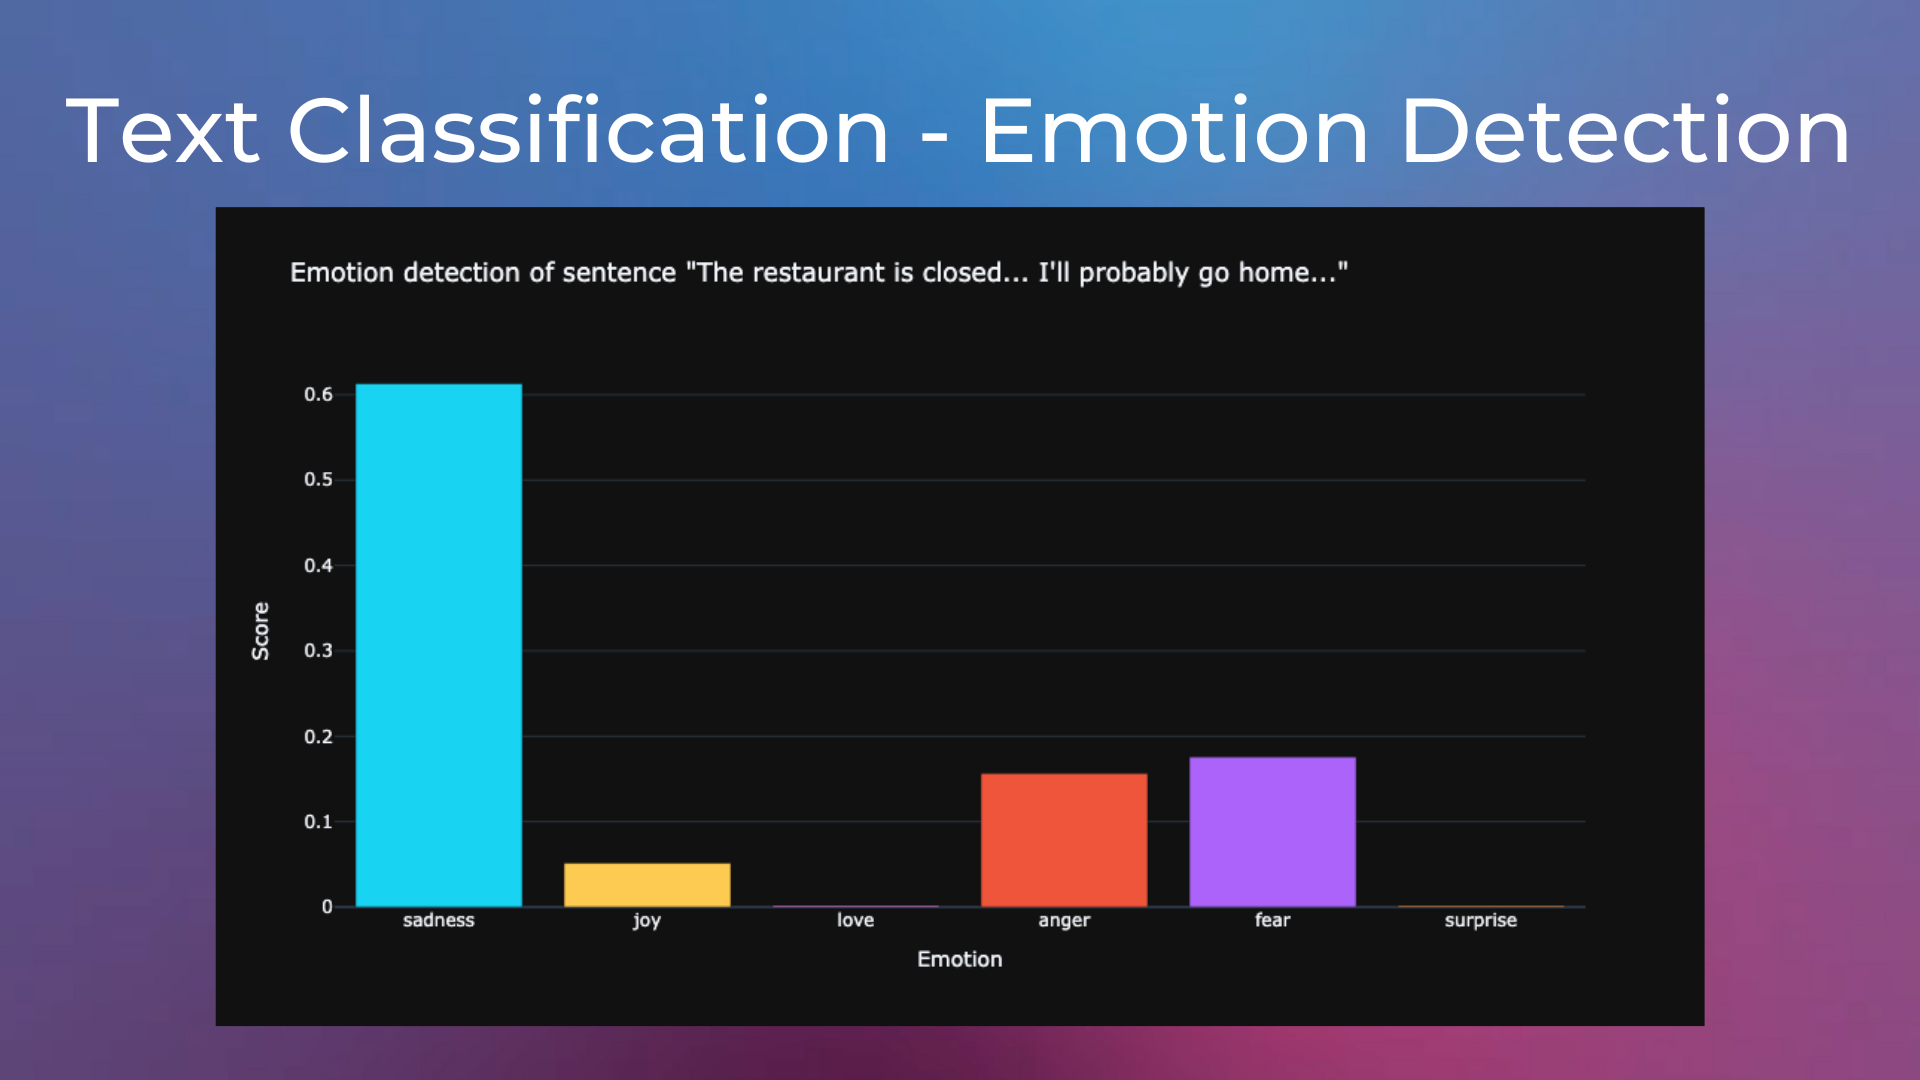
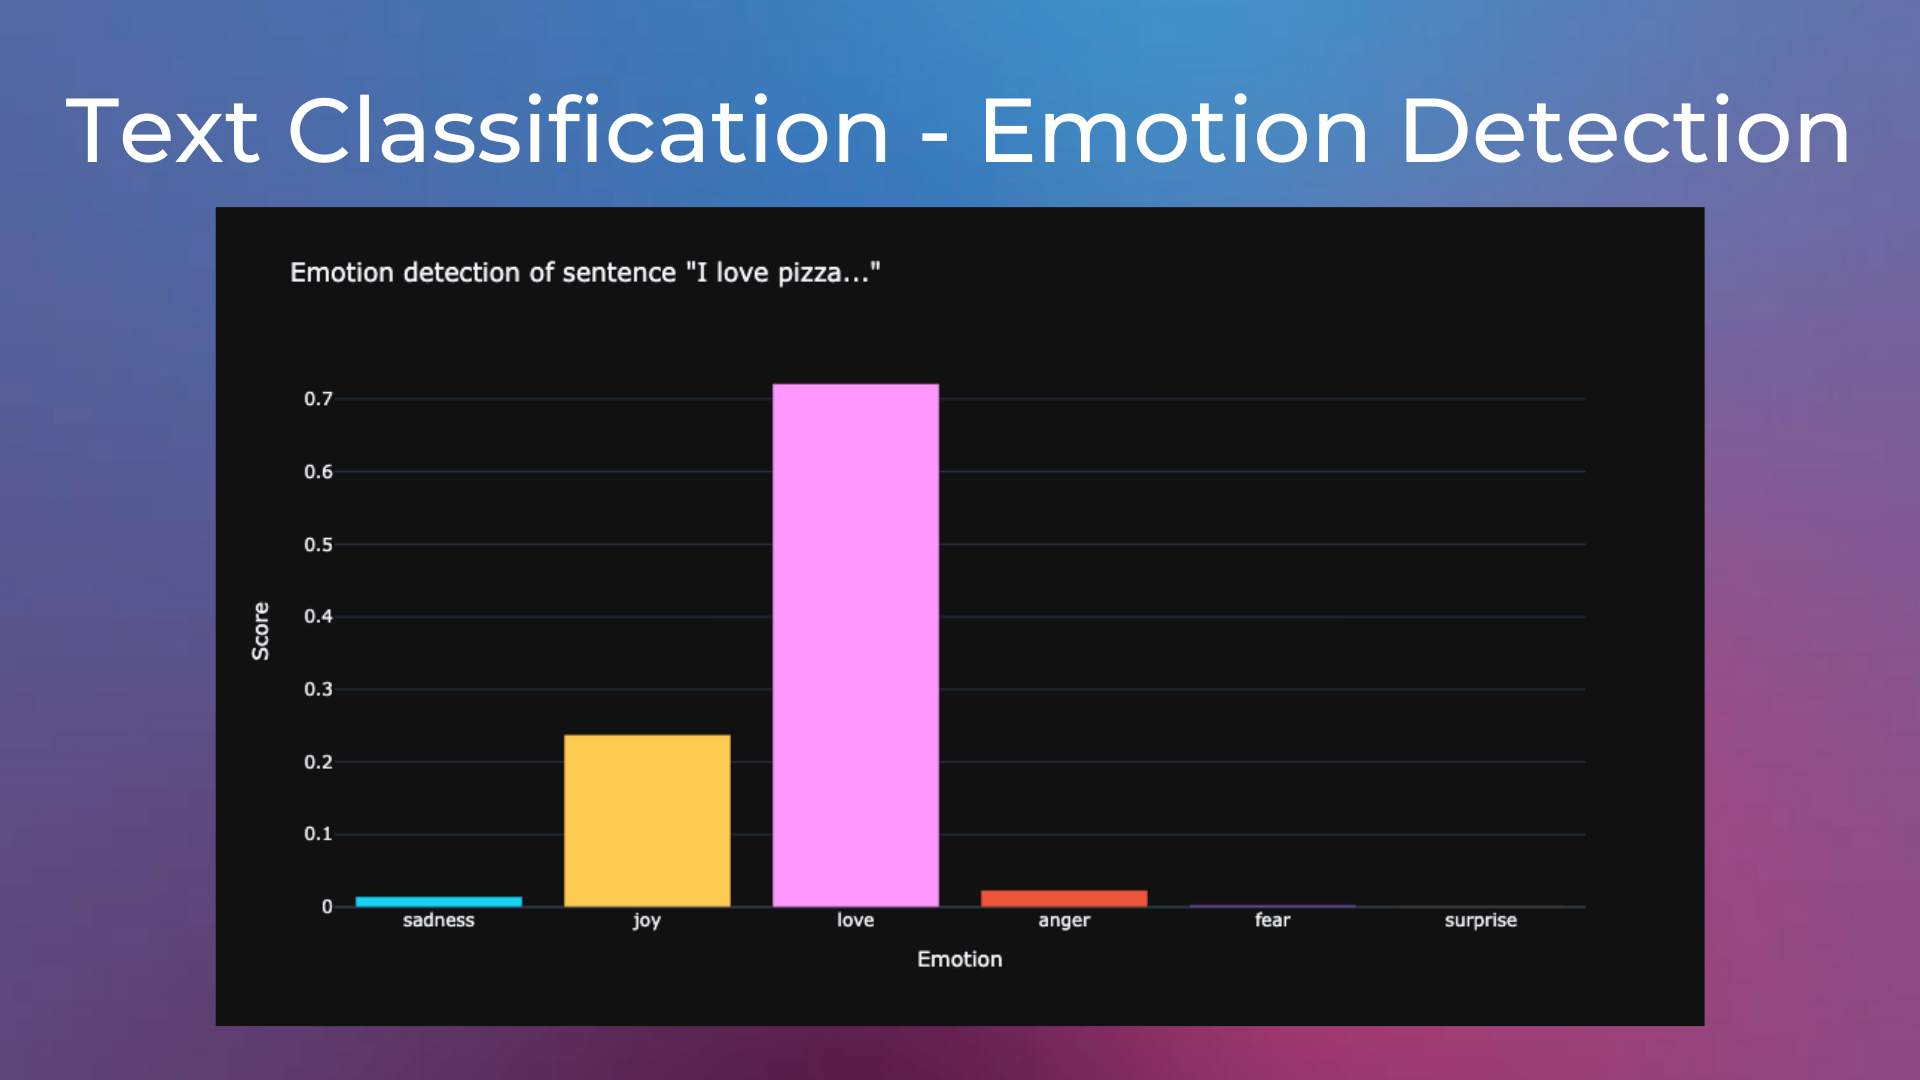
Emotion Detection is a technique that allows classifying texts with human emotions like “joy”, “surprise”, “anger”, “sadness”, “fear”, and “love”. It can be used to monitor how users react on social media to specific news or to posts of your company.


Emotion Detection on Tweets#
We use the same tweets dataset from the previous lessons, looking for tweets with specific keywords and detecting their sentiment.
Look for Suitable Pre-trained Models#
On the Hub we can find the j-hartmann/emotion-english-distilroberta-base model, which is a checkpoint of DistilRoBERTa-base fine-tuned on six diverse datasets to classify emotions from text. As reported on the model card, the accuracy of the model on the evaluation set is of 66%, way better than the random-chance baseline of 1/7 = 14%.
The j-hartmann/emotion-english-distilroberta-base classifies texts into seven classes:
anger 🤬
disgust 🤢
fear 😨
joy 😀
neutral 😐
sadness 😭
surprise 😲
Install and Import Libraries#
Let’s install and import the necessary libraries.
pip install transformers datasets
from datasets import load_dataset
from transformers import pipeline
import pandas as pd
import plotly.express as px
Get Tweets about Microsoft#
In a real-world scenario, we would use the Twitter API to download the latest tweets posted containing specific keywords. In this sample project, we download the test split of the Twitter Sentiment Analysis Training Corpus.
# download the tweets dataset
dataset = load_dataset("carblacac/twitter-sentiment-analysis", split="train")

# convert dataset to pandas dataframe
df = pd.DataFrame(dataset).drop("feeling", axis=1)
Let’s print some tweets from the dataset.
# show sample tweets
for tweet in df["text"][:5]:
  print(f"- {tweet}")
- @fa6ami86 so happy that salman won.  btw the 14sec clip is truely a teaser
- @phantompoptart .......oops.... I guess I'm kinda out of it.... Blonde moment -blushes- epic fail
- @bradleyjp decidedly undecided. Depends on the situation. When I'm out with the people I'll be in Chicago with? Maybe.
- @Mountgrace lol i know! its so frustrating isnt it?!
- @kathystover Didn't go much of any where - Life took over for a while
Then, we keep only the tweets containing the keyword “microsoft” and print some examples of them.
# keep only the tweets with a specific filter word. Let's try with "microsoft"
filter_word = "microsoft"
df_subset = df[df["text"].str.lower().str.contains(filter_word)].reset_index(drop=True)
# show sample tweets
for tweet in df_subset["text"][:5]:
  print(f"- {tweet}")
- @_everaldo Entourage *has* a really ugly interface but the app is quite useful. Microsoft did great work here. (Not *a* great work)
- Searching for Susan Boyle on Microsoft's Bing during the Twilight of a New Moon listening to Eminem on the radio hey Google Wave
- Microsoft Windows Guru program came to an end for a lot of east coast guru's
- So Microsoft released Bing, huh? Too bad they didn't filter this out  http://tr.im/n32Z
- Very sad  Microsoft money to be discontinue http://dhf0i.tk
Using the Emotion Detection Model#
Next, we load the j-hartmann/emotion-english-distilroberta-base emotion detection model into a text-classification pipeline and use it to classify each tweet with an emotion.
# download pre-trained emotion classification model
model = pipeline("text-classification", model="j-hartmann/emotion-english-distilroberta-base")

# compute the emotion of each tweet using the model
all_texts = df_subset["text"].values.tolist()
all_emotions = model(all_texts)
df_subset["emotion_label"] = [d["label"] for d in all_emotions]
df_subset["emotion_score"] = [d["score"] for d in all_emotions]
Let’s see how many tweets fall into each emotion category.
# plot emotions found in tweets
plot_title = f"Emotions found in tweets about '{filter_word}'"
fig = px.histogram(df_subset, x="emotion_label", template="plotly_dark",
                   title=plot_title, color="emotion_label")
fig.update_layout(showlegend=False)
fig.show()
Most tweets are usually classified with the classes “neutral”, “sadness” and “surprise”. Less tweets are classified with “joy”, “fear”, and “anger”. Very few tweets are usually classified with “disgust”.
Let’s see some tweets classified with the “joy” label.
# show sample of tweets with a specific emotion
for i,row in df_subset[df_subset["emotion_label"] == "joy"].iterrows():
  print(f'- {row["text"]}')
- Awesome press conference by Microsoft, also Project Natal is going to be a BIG HIT
- @g4tv Loved Sony's confrence its tied with Microsoft for me. Most excited for God Of War 3
- Kurt Moody packed the #Citrix booth at #teched. It also helps when Microsoft serves alcohol   http://twitpic.com/50s3i
- All the Microsoft E3 announcements look simply amazing. Congrats to the whole team!  Can't wait for 09.09.09 to get here now
Code Exercises#
Quiz#
What is Emotion Detection in NLP?
A technique that allows understanding the context of a text.
A way to predict the sentiment (positive or negative) of a text.
A technique that allows classifying texts with human emotions.
A tool to detect the level of understanding of a text.
Answer
The correct answer is 3.
What is the accuracy achieved by a random-chance baseline in a text classification problem with five classes?
50%
20%
14%
25%
Answer
The correct answer is 2: 1/5 = 20%
Questions and Feedbacks#
Have questions about this lesson? Would you like to exchange ideas? Or would you like to point out something that needs to be corrected? Join the NLPlanet Discord server and interact with the community! There’s a specific channel for this course called practical-nlp-nlplanet.

